In [1]:
# Imports
from d3blocks import D3Blocks
# https://d3blocks.github.io/d3blocks/pages/html
from datetime import datetime as dt
import json
import pandas as pd
from pprint import pp
from urllib import request

date = dt.now().strftime("%Y-%m-%d")
date
Out[1]:
'2024-11-08'
1. Load the JSON file and convert to dataframe
In [2]:
# Load the file from GitHub and (note that we're using the raw-URL)
metadata_url = "https://raw.githubusercontent.com/OP-TED/eForms-SDK/refs/heads/develop/fields/fields.json"
with request.urlopen(metadata_url) as url:
    data = json.load(url)
    # Print info about the metadata file
    ubl_version = data["ublVersion"]
    sdk_version = data["sdkVersion"]
    metadata_database = data["metadataDatabase"]
    print(f"{ubl_version = }\n{sdk_version = }\n{metadata_database = }")

# Get the xmlStructure (array of objects)
xml_structure = data["xmlStructure"]

# Look at the first three elements of the XML-structure
print("\nNumber of elements in xml_structure: ", len(xml_structure))
pp(xml_structure[:3])
ubl_version = '2.3'
sdk_version = 'eforms-sdk-1.14.0-SNAPSHOT'
metadata_database = {'version': '1.13.23', 'createdOn': '2024-10-31T15:55:40'}

Number of elements in xml_structure:  307
[{'id': 'ND-Root',
  'xpathAbsolute': '/*',
  'xpathRelative': '/*',
  'repeatable': False},
 {'id': 'ND-GazetteReference',
  'parentId': 'ND-Root',
  'xpathAbsolute': '/*/cac:AdditionalDocumentReference',
  'xpathRelative': 'cac:AdditionalDocumentReference',
  'xsdSequenceOrder': [{'cac:AdditionalDocumentReference': 34}],
  'repeatable': False},
 {'id': 'ND-BusinessCapability',
  'parentId': 'ND-Root',
  'xpathAbsolute': '/*/cac:BusinessCapability',
  'xpathRelative': 'cac:BusinessCapability',
  'xsdSequenceOrder': [{'cac:BusinessCapability': 35}],
  'repeatable': True}]
In [3]:
# Convert JSON (dict) to DataFrame, so that
# each row represent an XML element.
df_xml = pd.DataFrame(xml_structure)
# Save `df_xml` as CSV for later use
df_xml.to_csv("df_xml.csv", index=False, encoding="UTF-8")
# Print shape and look at first 5 rows
print(df_xml.shape)
df_xml[:5]
(307, 9)
Out[3]:
| id | xpathAbsolute | xpathRelative | repeatable | parentId | xsdSequenceOrder | identifierFieldId | captionFieldId | businessEntityId | |
|---|---|---|---|---|---|---|---|---|---|
| 0 | ND-Root | /* | /* | False | NaN | NaN | NaN | NaN | NaN |
| 1 | ND-GazetteReference | /*/cac:AdditionalDocumentReference | cac:AdditionalDocumentReference | False | ND-Root | [{'cac:AdditionalDocumentReference': 34}] | NaN | NaN | NaN |
| 2 | ND-BusinessCapability | /*/cac:BusinessCapability | cac:BusinessCapability | True | ND-Root | [{'cac:BusinessCapability': 35}] | NaN | NaN | NaN |
| 3 | ND-BusinessParty | /*/cac:BusinessParty | cac:BusinessParty | False | ND-Root | [{'cac:BusinessParty': 32}] | NaN | NaN | NaN |
| 4 | ND-BusinessContact | /*/cac:BusinessParty/cac:Contact | cac:Contact | False | ND-BusinessParty | [{'cac:Contact': 15}] | NaN | NaN | NaN |
The table has 307 rows and 9 columns.
id: The id (name) of the XML element.xpathAbsolute: Absoulute XML path to the element(s).xpathRelative: Relative XML path to the element(s).repeatable: Whether or not an element can be repeatable.parentId: The id (name) of the element's parent element.xsdSequenceOrder: ?identifierFieldId: ?captionFieldId: ?businessEntityId: The id of the corresponding business entity. Can be connected to businessEntities (another list/array in fields.json).
Each object in xml_structure and row in df_xml contains an id which is the name
of the XML element, and a parentId which is the id of its parent element. We
need these two properties to create graph and tree visualizations with d3blocks.
2. Adapt df_xml to the input
format required by d3blocks
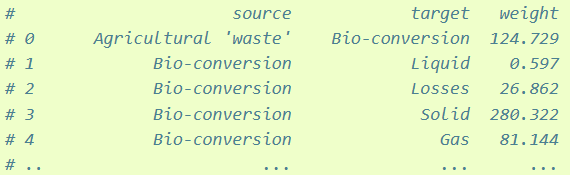
To visualize a graph and tree structure with d3blocks (read the docs here), we need at dataset with three columns: source, target and weight.
- I use
idas target andparentIdas source. This means that the arrows will go from parent to child in the case of a directed graph. - Currently we have no parameter that can act as weight, but we can create one, e.g. based on
the number of children an element has. First we'll just add the
weightcolumn with the value 1 for all elements.
Steps:
- Make a copy of
df_xmlcalleddf_treein which only the id, parentId columns are included. By keepingdf_xmlunchanged, we can later retrieve info from the columns that have been removed indf_tree, if needed. - In
df_tree:- Remove first row (we don't want to include
"NaN"as parent of"Root") --> 306 rows remain. - Remove the prefix
"ND-"to increase readability. - Rename columns:
id->target, andparentId->source. - Add the column
weightwith value1.
- Remove first row (we don't want to include
In [4]:
# Create copy of `df_xml` where id and parentId are included
df_tree = df_xml.copy()[["id", "parentId"]]

# Drop first row
df_tree = df_tree[1:]
print("Shape etter fjerning av første rad: ", df_tree.shape)

# Remove the prefix `"ND-"` to increase readability.
df_tree["id"] = df_tree["id"].str.replace("ND-", "")
df_tree["parentId"] = df_tree["parentId"].str.replace("ND-", "")

df_tree[:5]
Shape etter fjerning av første rad: (306, 2)
Out[4]:
| id | parentId | |
|---|---|---|
| 1 | GazetteReference | Root |
| 2 | BusinessCapability | Root |
| 3 | BusinessParty | Root |
| 4 | BusinessContact | BusinessParty |
| 5 | EuEntity | BusinessParty |
In [5]:
# Rename columns: `id` -> `target`, and `parentId` -> `source`.
df_tree = df_tree.rename(columns={"id": "target", "parentId": "source"})
# Add the column `weight` with value `1`.
df_tree["weight"] = 1
df_tree[:5]
Out[5]:
| target | source | weight | |
|---|---|---|---|
| 1 | GazetteReference | Root | 1 |
| 2 | BusinessCapability | Root | 1 |
| 3 | BusinessParty | Root | 1 |
| 4 | BusinessContact | BusinessParty | 1 |
| 5 | EuEntity | BusinessParty | 1 |
In [6]:
df_tree.to_csv("df_tree.csv", index=False, encoding="UTF-8")
3. Create graph and tree with d3graph
In [ ]:
# Initialize D3Blocks
d3 = D3Blocks()

# Create graph
d3.d3graph(
    df=df_tree,
    title="eForms XML struktur",
    collision=0.7, # Default=0.5. Higher -> prevent more collisions.
    charge=500, # Default=400. Higher -> less dense.
    color="cluster", # Based on community distance clusters.
    size="degree", # Based on centrality measure.
    opacity="degree", # Based on centrality measure.
    support=False, # Remove ad
)
# Set edge properties
d3.D3graph.set_edge_properties(directed=True, marker_end='arrow')

# Show and save the graph.
d3.D3graph.show(
    save_button=True, # Show save button
    show_slider=False, # Do not show slider
    figsize=(1500, 800),
    filepath=f"../charts/eForm-fields-graph-{date}.html"
)
In [ ]:
def make_tree(df, filepath=None):
    # Initialize D3Blocks
    d3 = D3Blocks(verbose=True, chart='tree', frame=False, support=False)

    # Set node- and edge properties
    d3.set_node_properties(df)
    d3.set_edge_properties(df)

    # Show and save the graph.
    d3.show(
        filepath=filepath,
        save_button=True, # Show save button
        figsize=[2200, 3400],
        # If the font is too big, the text will overlap horizontally.
        font={"size": 12}
    )

make_tree(
    df_tree,
    filepath=f"../charts/eForm-fields-tree-{date}.html")